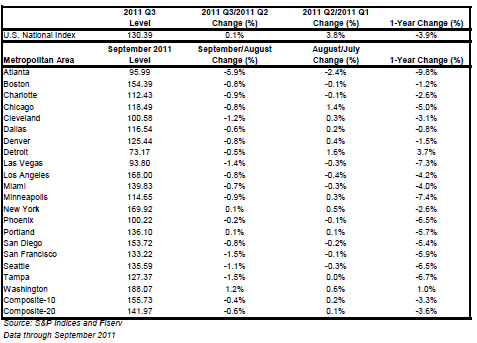
Data through September 2011, released today by S&P Indices for its
S&P/Case-Shiller Home Price Indices, the leading measure of U.S. home prices, show that nationally
home prices did not register a significant change in the third quarter of 2011, with the U.S. National
Home Price Index up by only 0.1% from its second quarter level. The national index posted an annual
decline of 3.9%, an improvement over the 5.8% decline posted in the second quarter. Nationally, home
prices are back to their first quarter of 2003 levels.
As of September 2011, the annual rate of change in 14 of the 20 MSAs and both Composites, covered by
S&P/Case-Shiller Home Price Indices, improved versus August. Atlanta, Las Vegas, Los Angeles, San
Francisco, Seattle and Tampa recorded lower annual declines in September compared to August. Detroit
and Washington DC were the only two MSAs to post positive annual rates of +3.7% and +1.0%
respectively. Detroit has now recorded three consecutive months of positive annual rates.
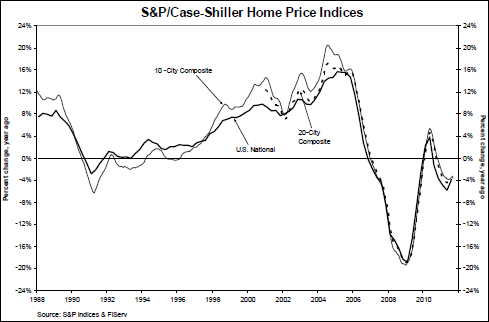
The chart above depicts the annual returns of the U.S. National, the 10-City Composite
and the 20-City Composite Home Price Indices. The S&P/Case-Shiller U.S. National Home Price Index,
which covers all nine U.S. census divisions, recorded a 3.9% decline in the third quarter of 2011 over the
third quarter of 2010. In September, the 10- and 20-City Composites posted annual rates of decline of
3.3% and 3.6%, respectively. Eighteen of the 20 MSAs and both monthly Composites had negative
annual rates in September 2011, the only exceptions being Detroit and Washington DC.
“Home prices drifted lower in September and the third quarter,” says David M. Blitzer, Chairman of the
Index Committee at S&P Indices. “The National Index was down 3.9% versus the third quarter of 2010
and up only 0.1% from the previous quarter. Three cities posted new index lows in September 2011 -
Atlanta, Las Vegas and Phoenix. Seventeen of the 20 cities and both Composites were down for the
month. Over the last year home prices in most cities drifted lower. The plunging collapse of prices seen
in 2007-2009 seems to be behind us. Any chance for a sustained recovery will probably need a stronger
economy.
“Detroit and Washington DC posted positive annual rates of change and also saw an improvement in
these rates compared to August. Only New York, Portland and Washington DC posted positive monthly
returns versus August. It is a bit disturbing that we saw three cities post new crisis lows. For the prior
three or four months, only Las Vegas was weakening each month. Now Atlanta and Phoenix have fallen
to new lows too. On a monthly basis, Atlanta actually posted a record low rate of -5.9% in September
over August. The markets are fairly thin, and the relative lack of closed transactions might be
exacerbating the downside. The relative good news is that 14 cities saw improvements in their annual
rates of change, versus the six that weakened.”
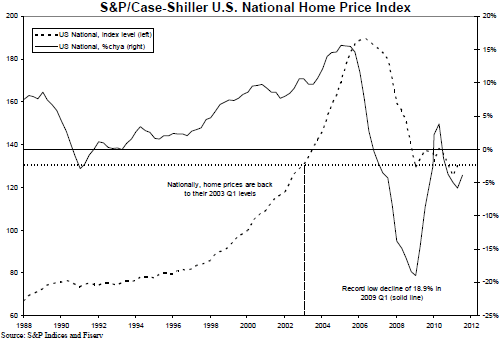
The chart above shows the index levels for the U.S. National Home Price Index, as well as
its annual returns. As of the third quarter of 2011, average home prices across the United States are back
at their early 2003 levels. As of the third quarter, the National Index level has recovered by +3.9% from
its recent index low in the first quarter of 2011. However, it is 3.9% below its 2010 Q3 level.
Atlanta, Las Vegas and Phoenix posted record index lows with September’s data. While Phoenix home
prices are almost back to their January 2000 levels, Atlanta and Las Vegas prices have fallen below these
levels.
The table below summarizes the results for September 2011. The S&P/Case-Shiller Home Price Indices
are revised for the 24 prior months, based on the receipt of additional source data. More than 24 years of
history for these data series is available, and can be accessed in full by going to
www.homeprice.standardandpoors.com
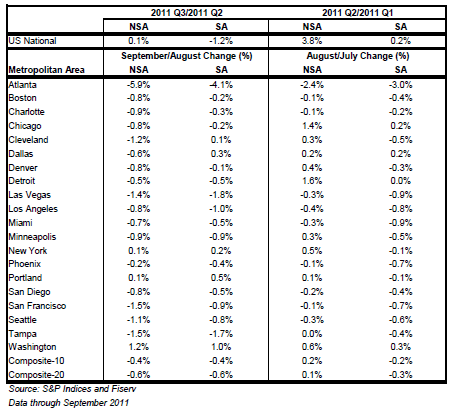
Since its launch in early 2006, the S&P/Case-Shiller Home Price Indices have published, and the markets
have followed and reported on, the non-seasonally adjusted data set used in the headline indices. For
analytical purposes, S&P Indices publishes a seasonally adjusted data set covered in the headline indices,
as well as for the 17 of 20 markets with tiered price indices and the five condo markets that are tracked.
A summary of the monthly changes using the seasonally adjusted (SA) and non-seasonally adjusted
(NSA) data can be found in the table below.
S&P Indices has introduced a new blog called HousingViews.com. This interactive blog delivers realtime commentary and analysis from across the Standard & Poor's organization on a wide-range of topics impacting residential home prices, homebuilding and mortgage financing in the United States. Readers and viewers can visit the blog at www.housingviews.com, where feedback and commentary is certainly welcomed and encouraged.