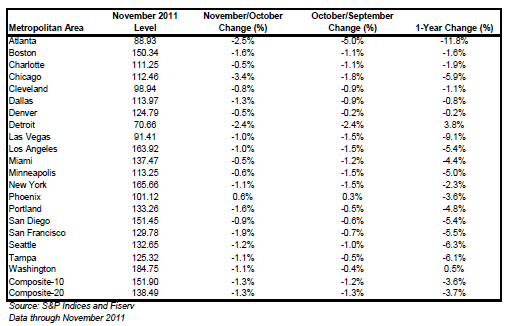
Data through November 2011, released today by S&P Indices for its
S&P/Case-Shiller Home Price Indices, the leading measure of U.S. home prices, showed declines of 1.3`%
for both the 10- and 20-City Composites in November over October. For a second consecutive month, 19 of
the 20 cities covered by the indices also saw home prices decrease. The 10- and 20-City Composites posted
annual returns of -3.6% and -3.7% versus November 2010, respectively. These are worse than the -3.2%
and -3.4% respective rates reported for October. In addition to both Composites, 13 of the 20 MSAs saw
their annual returns decrease compared to October’s data. New York and Tampa saw no change in annual
returns in November; while Charlotte, Cleveland, Denver, Minneapolis and Phoenix saw their annual rates
improve. At -11.8% Atlanta continued to post the lowest annual return. Detroit and Washington DC were
the only two cities to post positive annual returns of +3.8% and +0.5%, respectively, in November. While
positive, both cities saw these annual rates fall versus October’s data.
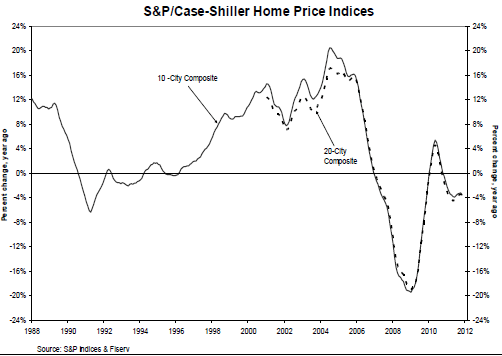
The chart above depicts the annual returns of the 10-City and the 20-City Composite Home Price Indices.
In November 2011, the 10- and 20-City Composites recorded annual returns of -3.6% and -3.7%,
respectively. Both Composites and 13 MSAs – Atlanta, Boston, Chicago, Dallas, Detroit, Las Vegas, Los
Angeles, Miami, Portland, San Diego, San Francisco, Seattle, and Washington DC – saw their annual rates
worsen in November compared to October.
“Despite continued low interest rates and better real GDP growth in the fourth quarter, home prices
continue to fall. Weakness was seen as 19 of 20 cities saw average home prices decline in November over
October,” says David M. Blitzer, Chairman of the Index Committee at S&P Indices. “The only positive for
the month was Phoenix, one of the hardest hit in recent years. Annual rates were little better as 18 cities and
both Composites were negative. Nationally, home prices are lower than a year ago. The 10-City Composite
was down 3.6% and the 20-City was down 3.7% compared to November 2010. The trend is down and there
are few, if any, signs in the numbers that a turning point is close at hand.
“The crisis low for the 10-City Composite was April 2009; for the 20-City Composite the more recent low
was March 2011. The 10-City Composite is now about 1.0% above its low, and the 20-City Composite is
only 0.6% above its low. From their 2006 peaks, both Composites are down close to 33% through
November.
“Atlanta continues to stand out in terms of recent relative weakness. It was down 2.5% over the month,
after having fallen by 5.0% in October, 5.9% in September and 2.4% in August. It also posted the weakest
annual return, down 11.8%. In addition, Atlanta, Las Vegas, Seattle and Tampa all reached new lows in
November.”
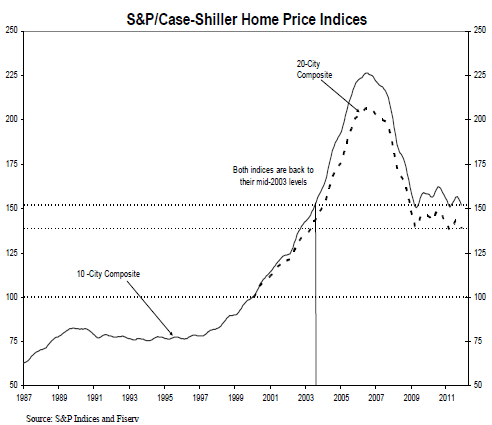
The chart above shows the index levels for the 10-City and 20-City Composite Indices. As of November
2011, average home prices across the United States are back to the levels where they were in mid-2003.
Measured from their June/July 2006 peaks through November 2011, the peak-to-current decline for both
the 10-City Composite and 20-City Composite is -32.9%. The recovery from recent lows are +1.0% and
+0.6%, respectively.
As in October 2011, Phoenix was the only MSA that posted a monthly gain, +0.6% in November. Both the
10-City and 20-City Composites were down 1.3%, from their October 2011 levels. Atlanta, Cleveland,
Detroit and Las Vegas were the four cities where average home prices were below their January 2000
levels.
The table below summarizes the results for November 2011. The S&P/Case-Shiller Home Price Indices
are revised for the 24 prior months, based on the receipt of additional source data. More than 24 years of
history for these data series is available, and can be accessed in full by going to
www.homeprice.standardandpoors.com
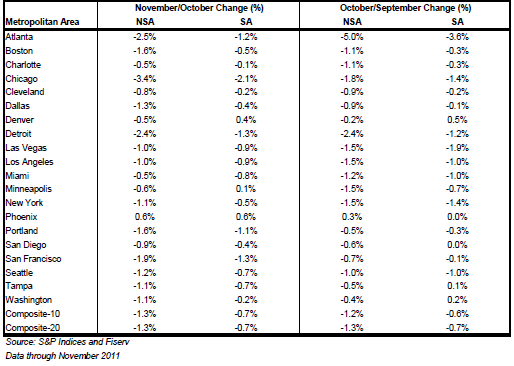
Since its launch in early 2006, the S&P/Case-Shiller Home Price Indices have published, and the markets
have followed and reported on, the non-seasonally adjusted data set used in the headline indices. For
analytical purposes, S&P Indices publishes a seasonally adjusted data set covered in the headline indices,
as well as for the 17 of 20 markets with tiered price indices and the five condo markets that are tracked.
A summary of the monthly changes using the seasonally adjusted (SA) and non-seasonally adjusted
(NSA) data can be found in the table below.
S&P Indices, a leading brand of the McGraw-Hill Companies, maintains a wide variety of
investable and benchmark indices to meet an array of investor needs. Over $1.45 trillion is directly indexed
to our indices, which includes the S&P 500, the world's most followed stock market index, the S&P/Case-
Shiller Home Price Indices, the leading measure of U.S. home prices, the S&P Global BMI, an index with
approximately 11,000 constituents, the S&P GSCI, the industry's most closely watched commodities index,
and the S&P National AMT-Free Municipal Bond Index, the premier investable index for U.S. municipal
bonds. For more information, please visit: www.standardandpoors.com/indices.